The CPU average load value is a very important metric to understand the behavior of a Linux system, and especially its current and recent past status. Many times there is confusion between this term and percentage of CPU usage , but differences are important. In this article I will try to explain the true meaning of both and how to tell if a Linux box is overloaded or underutilized.
Average load value
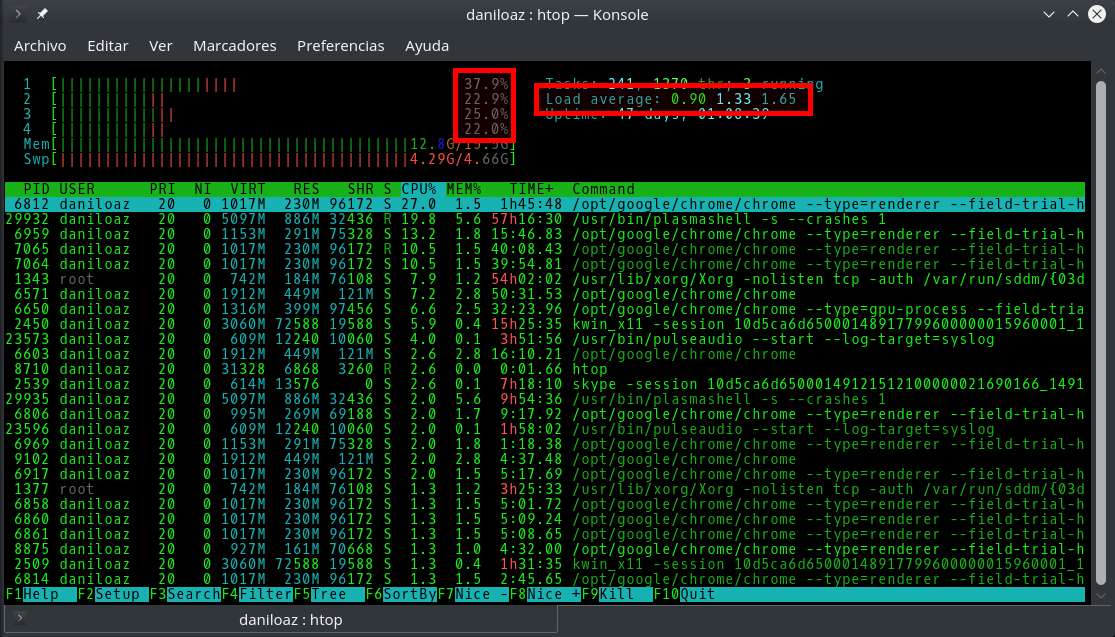
It is shown in the different monitoring tools (top , atop , htop , etc.) as a set of 3 values representing the average CPU load experienced by a Linux system in the last 1, 5 and 15 minutes respectively. Therefore, a first difference is that these are historical values, while the percentage of CPU usage is typically measured in intervals of between 1 and 5 seconds, so their value is usually almost instantaneous.
The CPU load value represents in Linux the average number of jobs (read a set of program instructions in machine language corresponding to a process execution thread) that are running , in runnable state , or, very important, asleep but not interruptible (uninterrumpible sleep state). That is to say, to calculate the value of CPU load only the processes that are running or waiting to be assigned CPU time are taken into account. Normal asleep processes (sleep state), zombies, or stopped processes are not considered.
PROCESS STATE CODES
R running or runnable (on run queue)
D uninterruptible sleep (usually IO)
S interruptible sleep (waiting for an event to complete)
Z defunct/zombie, terminated but not reaped by its parent
T stopped, either by a job control signal or because
it is being traced
[…]
This is the meaning of different load values in a single-core processor computer:
- 0.00: there are no jobs either running or waiting to be executed by the CPU, ie, the CPU is completely idle. Thus, if a running program (process) needs to perform a task, it requests the CPU to the operating system and it instantly allocates CPU time for that process because there is no other process competing for it.
- 0.50: there are no jobs waiting, but the CPU is processing previous jobs and it is doing so at 50% of its capacity. In this situation the operating system could also instantly allocate CPU time to other processes without having to put them on hold.
- 1.00: there are no jobs in the queue but the CPU is processing previous jobs at 100% of its capacity , so if a new process requests CPU time it will have to be put on hold until another job is completed or current CPU slot time (CPU tick) expires and the operating system decides which one is the next given the process priority, for example.
- 1.50: the CPU is working at 100% of its capacity and 5 out of 15 jobs requesting CPU time, ie 33.33%, have to queue waiting for others to exhaust their allotted time. Therefore, once the threshold of 1.0 is exceeded, it can be said that the system is overloaded , since it can not immediately attend to 100% of the jobs requested.
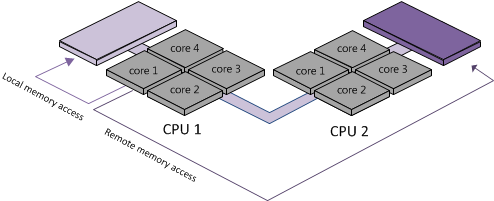
Multiprocessor and multicore systems
In systems with multiple processors or cores (multiple logical CPUs), the meaning of CPU load value varies depending on the number of processors present in the system. Thus, a computer with 4 processors will not be used at 100% until it reaches a load of 4.00, so the first thing you have to do when interpreting the 3 load values offered by commands like top , htop or uptime is to divide them between the number of logical CPUs present in your system , and from there draw conclusions.
Percentage of CPU utilization
If we observe the different processes passing through the CPU during a given time interval, the utilization percentage would represent the fraction of time with respect to that interval that the CPU has been executing instructions corresponding to each of those processes. But for this calculation only running processes , not those that are waiting, whether they are in queue (runnable state) or asleep but not interruptible (for example waiting for the end of an input/output operation) are considered.
Therefore, this metric can give us an idea of which processes squeeze a CPU the most, but does not give us a true picture of system status , if it is overloaded or if it is being underused.
Beware of input/output (I/O) operations
I emphasized at the beginning of this post as very important the uninterruptible sleep state (D in the above diagram) because sometimes you can find extraordinarily high load values in your computer and nevertheless the different running processes have a relatively low percentage of use. If you do not consider this state you will find the situation inexplicable and you will not know how to approach it. A process is in this state when it is waiting for the release of some resource and its execution can not be interrupted, for example when it waits for a non-interruptible I/O operation to finish (not all are uninterruptible). Typically, this situation occurs due to disk failures, network filesystems such as NFS malfunction, or because of the heavy use of a very slow device, for example USB 1.0 pendrive.
In this scenario we will have to use alternative tools such as iostat or iotop , which will indicate which processes are performing a greater number of I/O operations, so that we can kill those processes or assign them less priority (nice command) to be able to allocate more CPU time to other more critical processes.
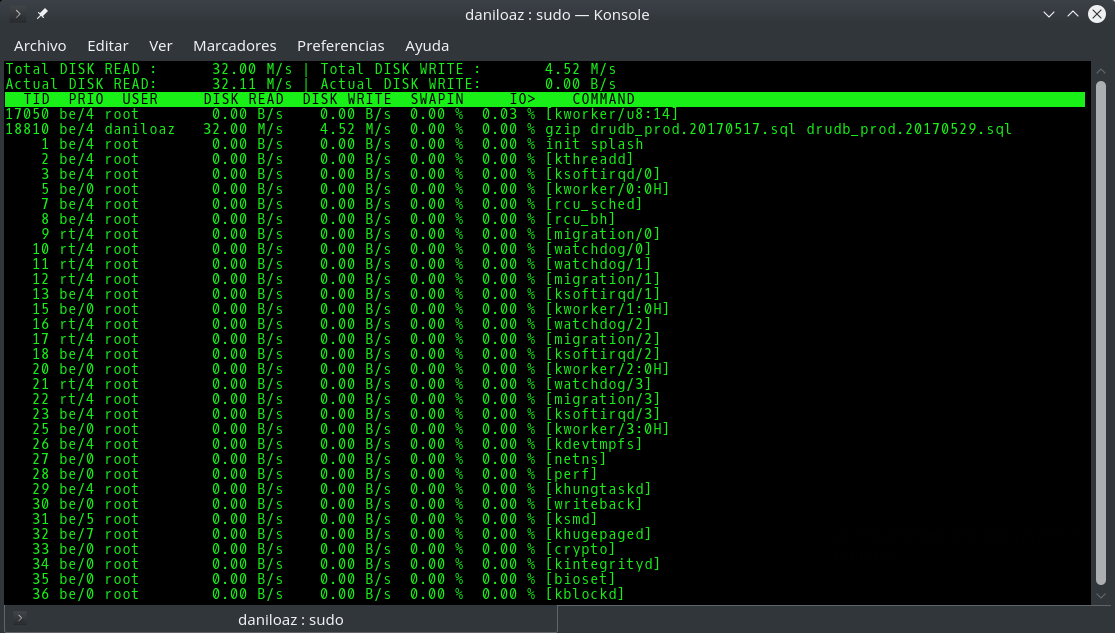
iotop
Some tips
That the system overloads and exceeds load values of 1.0 sometimes is not a problem, because even with some delay the CPU will process the jobs in queue and the load will again decrease to values below 1.0. But if the system has sustained load values above 1 it means that it is not able to absorb all the load in execution, so its response times will increase and the system will become slow and unresponsive. High values above 1, especially in the load averages of the last 5 and 15 minutes are a clear symptom that either we need to improve the hardware of that computer, require less resources by limiting the use that users can make of the system, or divide the load between multiple similar nodes.
Thus, I make the following recommendations:
-
= 0.70: nothing happens but it is necessary to monitor the CPU load. If it is maintained over time it is necessary to investigate before things go to worse.
-
= 1.00: there is a problem and you have to find it and fix it, otherwise a major peak in system load will cause your applications to become slow or unresponsive.
-
= 3.00: your system is becoming desperately slow. It is even difficult to operate it from the command line to try to find the cause of the problem, so it will take longer to fix the issue than if we had acted before. You run the risk that the system will saturate even more and definitely collapse.
-
= 5.00: you probably will not be able to recover the system. You can wait for a miracle to lower the load spontaneously, or if you have an idea of what is happening and you can afford it, you can launch a command like
pkill -9 <process_name>in the console and pray for it to be run at some point in order to alleviate the system load and regain its control. Otherwise for sure you will have no choice but to reboot your computer.

Comments
Submit comment